Complete documentation for all ClassiPyR features.
Interface Overview
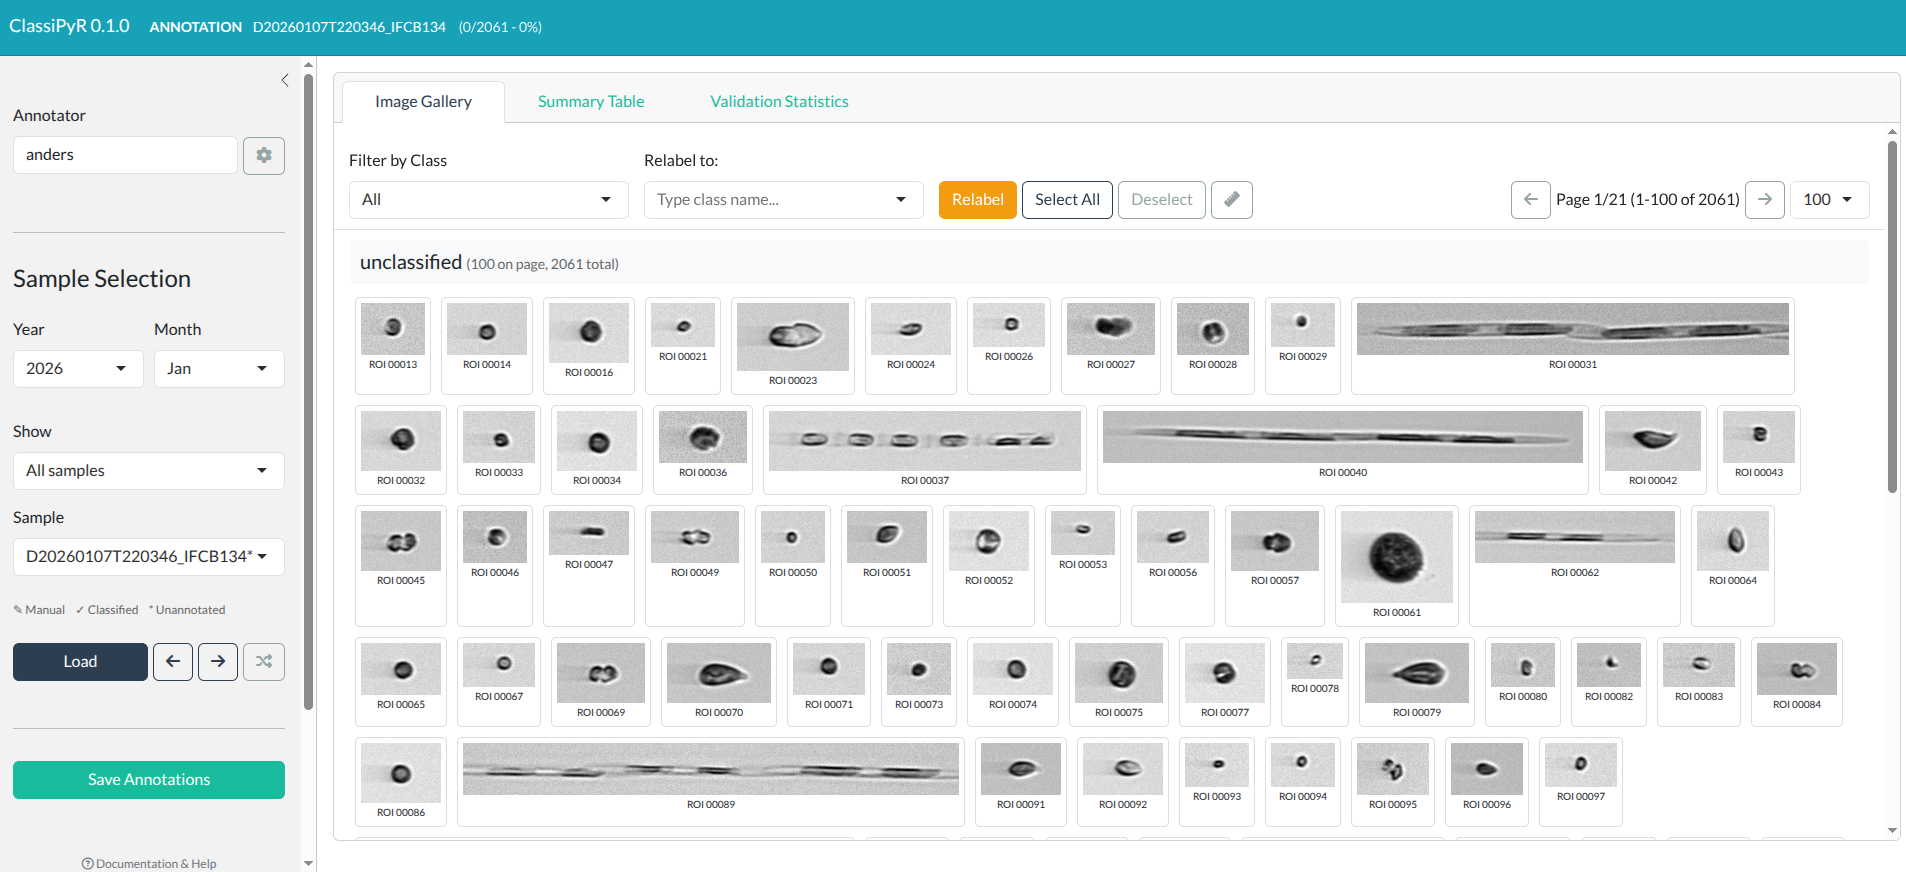
ClassiPyR interface showing the title bar, sidebar, and main image gallery area. Click to enlarge.
Title Bar
- App name and version
-
Mode indicator: Shows current state and mode
- No sample loaded: Initial state before selecting a sample
- Validation mode: Shows accuracy percentage
- Annotation mode: Shows progress (X/Y classified)
- Class Review mode: Shows selected class and image counts
Sidebar
- Annotator name: Your name for statistics tracking
- Settings: Configure folders and options
- Sample selection: Year, month, status filters
- Navigation: Load, previous, next, random, sync
- Cache age: Shows when folders were last scanned
- Save button: Manual save trigger
- Predict button: One-click CNN classification (when configured)
- Clear Annotations: Delete a sample’s annotations from the database (annotation mode only)
Validation vs Annotation Mode
Validation Mode
- Activated when loading samples with existing auto-classifications
- Original classifications shown with confidence scores
- Statistics track how many you’ve changed
- Accuracy percentage calculated
Annotation Mode
- Activated for samples without classifications
- All images start as “unclassified”
- Progress shows classified vs remaining
- Validation statistics tab shows annotation progress instead
Switching Between Modes
Any sample with auto-classification data (✓ or ✎✓) shows a mode toggle button in the header bar:
- → Manual (in validation mode): Switch to annotation mode. If manual annotations exist they are loaded; otherwise blank “unclassified” annotations are created.
- → Validation (in annotation mode): Switch back to the original auto-classifications.
Samples with only manual annotations (✎) or no data at all (*) do not show the toggle.
Class Review Mode
Class Review mode lets you view all annotated images of a specific class and reclassify them. There are two sources to choose from: the SQLite Database or an External PNG Folder.

Class Review mode showing all images of a selected class across the database. Click to enlarge.
Database review
Review all annotated images of a class across the entire database:
- Switch to Class Review using the mode toggle in the sidebar
- Select Database as the source (default)
- The class dropdown is searchable — type to filter. Each class shows its image count in parentheses
- Select a class and click Load — images are loaded from ROI files or discovered PNG sample folders across all samples
- Review images in the gallery. Each image label shows the full name (sample + ROI) so you can identify which sample it belongs to
- Use the same selection and relabeling tools as in sample mode
- Click Save Changes to write row-level updates to the database
External folder review
Review and split a folder of PNG images (e.g. from an external classifier or export) into class subfolders:
- Switch to Class Review and select External PNG Folder as the source
- Browse to the folder containing PNG images
- The initial class label defaults to the folder name — change it if needed
- Click Load Folder — all PNGs are loaded into the gallery with the initial class label
- Select images and relabel them to different classes
- Set an Export Folder and click Export Split Folders — images are copied into class-name subfolders
This is useful for sorting or correcting a flat folder of images without importing them into the database.
Key differences from sample mode
- Images come from multiple samples (database) or a single folder (external), not a single sample
- Image labels show the full image name
(e.g.
D20230101T120000_IFCB134_00001) instead of just the ROI number (database mode) - Saving performs surgical row-level UPDATEs rather than replacing an entire sample’s annotations (database mode)
- The title bar turns purple to indicate class review mode
- Navigation buttons (prev/next/random sample) are not available
Live Prediction
The Predict button in the sidebar lets you classify
all images in the loaded sample using a remote CNN model, without
needing pre-computed classifier files. This uses
iRfcb::ifcb_classify_images() to send images to a
Gradio-hosted classification model.
Setup
- Open Settings (gear icon)
- Under Live Prediction, enter a Gradio API URL
(e.g.
https://irfcb-classify.hf.space) - The Prediction Model dropdown is populated automatically from the server
- Select a model and click Save Settings
The Predict button appears in the sidebar once a Gradio URL and model are configured.
Using Predict
- Load a sample in Sample Mode (annotated or unannotated)
- Click Predict in the sidebar
- A progress bar shows per-image classification progress
- When complete, the app switches to validation mode with the predicted classes
Behaviour details
- Manual labels are preserved: If you have already reclassified some images, those are skipped during prediction. Only unchanged images are sent to the model.
- Threshold setting applies: The “Apply classification threshold” setting controls whether thresholded or raw predictions are used, just like for CSV/H5/MAT classifications.
- New classes are added automatically: If the model returns class names not in your current class list, they are added so the filter and relabel dropdowns work correctly.
- Predictions become the baseline: After prediction, the predicted classes are treated as the “original” classifications for validation statistics.
Working with Images
Image Cards
Each image card displays:
- The plankton image
- ROI number (in sample mode) or full image name (in class review mode)
- Classification score (if available)
- Original class (if relabeled)
Border colors:
- Default (gray): Unchanged
- Yellow: Relabeled in this session
- Blue: Currently selected
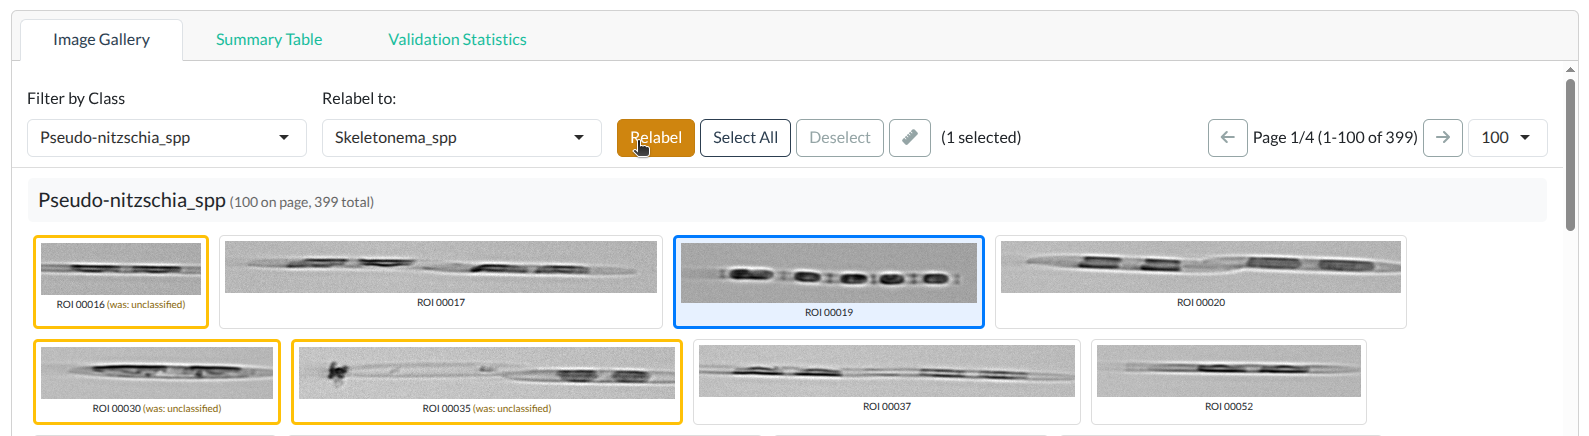
Image card border colors: gray (unchanged), yellow (relabeled), blue (selected). Click to enlarge.
Selecting Images
| Method | Action |
|---|---|
| Click | Toggle single image selection |
| Drag | Draw rectangle to select multiple |
| Select Page / Select All | First click selects the current page; second click selects all images across all pages |
| Deselect | Clear all selections |
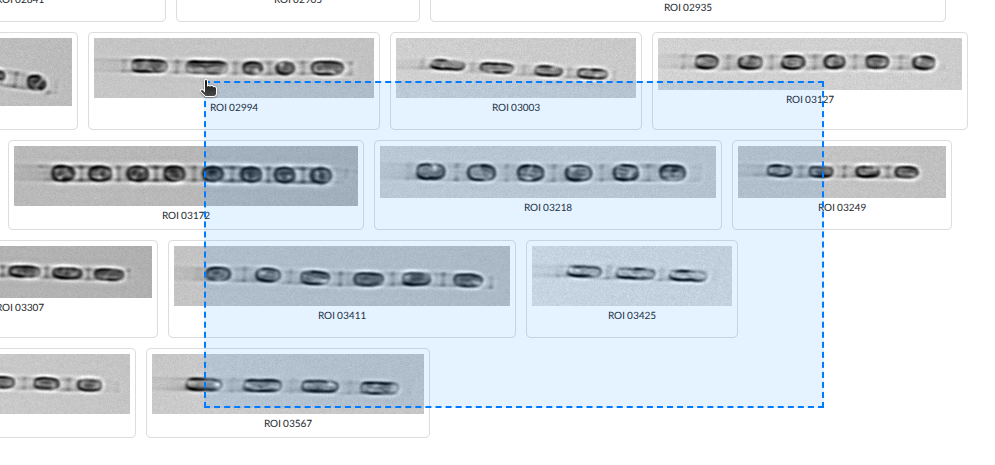
Drag-select: draw a rectangle to select multiple images at once. Click to enlarge.
Measuring Images
The measure tool allows you to measure distances in images.
Using the Measure Tool
- Click the Measure button (ruler icon) in the toolbar to activate measure mode
- Click and drag on any image to draw a measurement line
- The distance is displayed in both micrometers (µm) and pixels
- Click elsewhere on the image to clear the measurement
- Click the Measure button again to deactivate measure mode
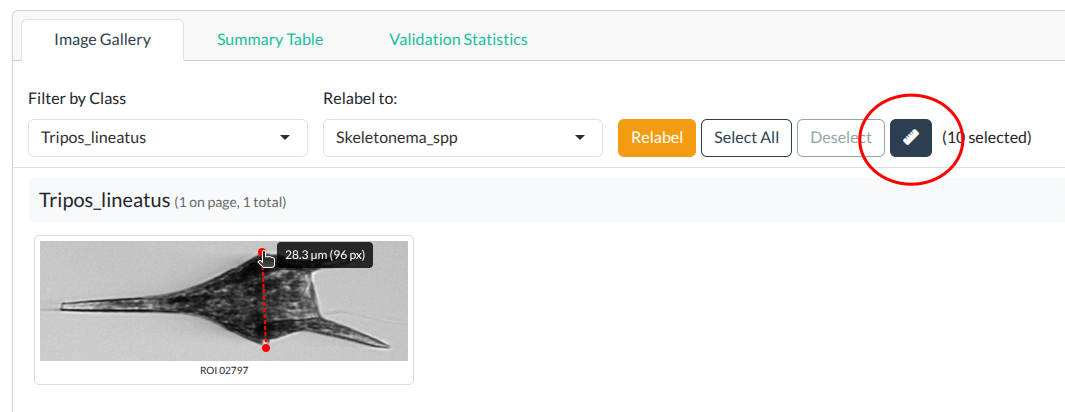
Measure tool showing distance in micrometers and pixels. Click to enlarge.
Classification Sources
ClassiPyR supports multiple classification input
formats. When multiple formats exist for the same sample, the priority
is: CSV > H5 > MAT. Samples without any pre-computed
classifications can be classified on the fly using Live Prediction.
All formats (including live predictions) support a classification threshold option (configurable in Settings under the Classification Folder). When enabled, predictions below the confidence threshold are shown as “unclassified”; when disabled, the raw (unthresholded) class prediction is used.
CSV Files
Standard classification CSV output from iRfcb. The CSV
file must be named after the sample it describes (e.g.,
D20230101T120000_IFCB134.csv).
Required columns (exact names):
-
file_name: Image filename including.pngextension (e.g.,D20230101T120000_IFCB134_00001.png) -
class_name: Predicted class name (threshold-applied)
Optional columns:
-
score: Classification confidence (0-1) -
class_name_auto: Raw class prediction without threshold (used when threshold is disabled)
Minimal example:
file_name,class_name
D20230101T120000_IFCB134_00001.png,Diatom
D20230101T120000_IFCB134_00002.png,Ciliate
Example with confidence scores and raw predictions:
file_name,class_name,class_name_auto,score
D20230101T120000_IFCB134_00001.png,unclassified,Diatom,0.45
D20230101T120000_IFCB134_00002.png,Ciliate,Ciliate,0.87
Different CNN pipelines: If your classifier produces
different column names, rename them to file_name and
class_name before placing the CSV in the Classification
Folder.
Files are looked up from the file index cache (see File Index Cache below).
HDF5 Classifier Output
Files matching *_class*.h5 pattern, produced by iRfcb (>=
0.8.0). Contains:
-
roi_numbers: ROI identifiers -
class_name: Predicted class with threshold applied -
class_name_auto: Predicted class without threshold -
output_scores: Per-class confidence scores -
class_labels: All possible class names -
classifier_name: Name of the classifier model
Requires the optional hdf5r
package. Install with install.packages("hdf5r").
MATLAB Classifier Output
Files matching *_class*.mat pattern from ifcb-analysis
containing:
-
roinum: ROI numbers -
TBclass_above_threshold: Predicted class with threshold -
TBclass: Predicted class without threshold
File Index Cache
To avoid slow startup from scanning large folder hierarchies,
ClassiPyR maintains a file index cache on disk. The cache
stores the locations of all ROI, classification, and annotation files
found in your configured folders.
How it Works
- On first launch (or after changing folder paths in Settings), the app scans all configured folders and saves the results to a JSON cache file
- On subsequent launches, the app loads the cached index instantly instead of re-scanning
- The cache is stored alongside your settings in the platform config directory (see Settings Persistence)
Sync Button
The Sync button (circular arrow icon) in the sidebar navigation row triggers a manual rescan of all folders. Use this when:
- You’ve added new IFCB data files to your folders
- The sample dropdown seems out of date
- You want to force a fresh scan
The cache age indicator below the navigation buttons shows when the folders were last scanned (e.g. “synced just now”, “synced 2 hours ago”).
Auto-Sync
By default, the app checks whether the cache matches your current folder settings on startup and rescans automatically if needed. You can disable auto-sync in Settings to always load from the existing cache, which provides the fastest possible startup.
Headless Rescan
You can update the file index cache without launching the app using
rescan_file_index(). This is useful for scheduled updates
(e.g. cron jobs) on servers where new data arrives regularly:
# Rescan using saved settings
ClassiPyR::rescan_file_index()

# Or specify folder paths explicitly
ClassiPyR::rescan_file_index(
  roi_folder = "/data/ifcb/raw",
  csv_folder = "/data/ifcb/classified",
  output_folder = "/data/ifcb/manual"
)
Output Files
When you save, the app creates files based on your chosen storage format (configurable in Settings).
SQLite Database (default)
db_folder/annotations.sqlite
A single SQLite database file containing annotations for all samples. This is the default storage backend:
- No Python dependency required
- Fast read/write performance
- Single file for all samples — easy to back up and manage
- Contains
annotationstable (one row per ROI) andclass_liststable (preserves class indices for.matexport)
The database is stored in a separate Database Folder
(configurable in Settings), which defaults to a local user-level
directory (tools::R_user_dir("ClassiPyR", "data")). This
separation ensures the SQLite database stays on a local filesystem even
when the Output Folder is on a network drive.
Note: The SQLite database must be on a local drive. SQLite file locking is unreliable on network filesystems (NFS/SMB), which can lead to database corruption. For multi-user workflows, each annotator should use their own local Database Folder.
Annotation MAT File (optional)
output/[sample_name].mat
MATLAB-compatible format with:
-
classlist: ROI numbers and class indices - Compatible with ifcb-analysis toolbox
Note: Saving MAT files requires Python with scipy. Enable in Settings > Annotation Storage by selecting “MAT file” or “Both”.
Settings Reference
Data Source
ClassiPyR supports two data source modes, selectable in Settings:
| Mode | Description |
|---|---|
| Local Folders (default) | Read IFCB data from local ROI/ADC/HDR files |
| IFCB Dashboard | Connect to a remote IFCB Dashboard instance |
IFCB Dashboard Mode
When “IFCB Dashboard” is selected, enter a Dashboard URL such as:
-
https://habon-ifcb.whoi.edu/timeline?dataset=tangosund— a specific dataset (recommended) -
https://habon-ifcb.whoi.edu/— all datasets on the dashboard
Tip: Always include
?dataset=in the URL when working with large Dashboard instances. Dashboards likehabon-ifcb.whoi.eduhost hundreds of thousands of samples across many datasets — loading all of them at once will be very slow and may cause the interface to become unresponsive. Specifying a dataset keeps the sample list manageable and ensures faster startup.
The app fetches the sample list from the Dashboard API. When you load
a sample, PNG images are downloaded from the dashboard and cached
locally at
tools::R_user_dir("ClassiPyR", "cache")/dashboard/. ADC
files are downloaded on demand for image dimensions and MAT export.
| Dashboard Setting | Description |
|---|---|
| Dashboard URL | The full URL of the IFCB Dashboard (with optional
?dataset= parameter) |
| Use dashboard auto-classifications | When checked, downloads the dashboard’s
_class_scores.csv for validation mode |
| Advanced Download Settings | Parallel downloads, sleep time, timeout, and max retries for dashboard downloads |
The Classification Folder setting is available in both local and dashboard mode. In dashboard mode, the classification source depends on the “Use dashboard auto-classifications” checkbox:
When “Use dashboard auto-classifications” is disabled (default):
- Database annotations (manual, existing)
- Local classification files (CSV > H5 > MAT) — if Classification Folder is configured
- New annotation mode
When “Use dashboard auto-classifications” is enabled:
- Database annotations (manual, existing)
- Dashboard auto-classifications (downloaded
_class_scores.csv) - New annotation mode
Local classification files and dashboard auto-classifications are mutually exclusive — the checkbox determines which source is used.
Note: In dashboard mode, the ROI/PNG Data Folder setting is not used. The Output Folder, Database Folder, and PNG Output Folder still apply for saving annotations and exports.
Folder Paths
| Setting | Description |
|---|---|
| Classification Folder | Source of CSV/H5/MAT classifications (both local and dashboard mode) |
| ROI/PNG Data Folder | IFCB raw files (ROI/ADC/HDR) or extracted PNG sample folders (local mode only) |
| Output Folder | Where MAT files and statistics go (can be on a network drive) |
| Database Folder | Where the SQLite database is stored (must be a local drive) |
| PNG Output Folder | Where organized images go |
Folder paths are configured using a web-based folder browser that works on all platforms (Linux, macOS, Windows). Changing folder paths in Settings automatically invalidates the file index cache, triggering a fresh scan.
Annotation Storage
| Format | Description |
|---|---|
| SQLite (recommended) | Default. Stores annotations in annotations.sqlite in
the Database Folder. No Python needed. |
| MAT file | MATLAB-compatible .mat files for ifcb-analysis.
Requires Python with scipy. |
| Both | Writes to both SQLite and .mat for maximum
compatibility. |
Below the format selector, two buttons allow bulk conversion between formats:
-
Import .mat → SQLite: Imports all
.matannotation files from the output folder into the SQLite database. Already-imported samples are skipped. -
Import PNG → SQLite: Imports annotations from a
folder of PNG images organized in class-name subfolders. Class names are
extracted from folder names (trailing
_NNNsuffixes are stripped). Useful for re-importing corrected exports or importing external classification datasets. -
Export SQLite → .mat: Exports all annotated samples
from the database to
.matfiles in the specified Output Folder. Requires Python with scipy. - Export SQLite → PNG: Extracts annotated images from ROI files into class-name subfolders in the PNG Output Folder. Useful for building training datasets for CNN classifiers.
-
Export SQLite → ZIP: Builds an EcoTaxa-ready ZIP
archive from SQLite annotations that is also suitable for sharing
datasets in general repositories (for example Zenodo or Figshare). The
export writes class-organized PNGs, per-class inventories
(
ecotaxa_<CLASSNAME>.tsv), and a README file. -
Export SQLite → MATLAB ZIP: Builds a MATLAB-format
ZIP archive via
iRfcb::ifcb_zip_matlab(), bundling.matannotation files, feature CSVs, aclass2use.matconfig file, optional raw data (.roi, .adc, .hdr), and README files. When using SQLite-only storage the annotations are automatically converted to temporary.matfiles (requires Python with scipy). See the iRfcb image export tutorial for more details on the MATLAB ZIP format.
The Export SQLite → ZIP and Export SQLite → MATLAB ZIP dialogs include optional README metadata fields:
- Author
- Contact e-mail
- DOI
- Licence
- Version
- Citation
- Institute
These values are saved in settings and reused for future ZIP exports. Empty fields are omitted from the README.
ZIP export also supports archive splitting via split_zip
and max_size (MB), matching
iRfcb::ifcb_zip_pngs().
The MATLAB ZIP dialog additionally requires a Features folder (top-level folder containing feature CSV files) and an optional Data folder (raw IFCB data). Both have a “search recursively” checkbox enabled by default so that files in year-based subdirectories are included automatically.
Both ZIP export dialogs include an optional Filter by IFCB dropdown (shown when the database contains samples from more than one instrument). This lets you restrict the export to a single instrument, e.g. to exclude data from a test or development instrument.
Note: External datasets can be viewed without ROI files when extracted PNGs are available under sample-named folders in the ROI/PNG Data Folder. MAT export still requires ADC data (from local files or IFCB Dashboard).
WoRMS (AphiaID) Matching
Class list entries can be linked to WoRMS AphiaIDs in the Class List Editor:
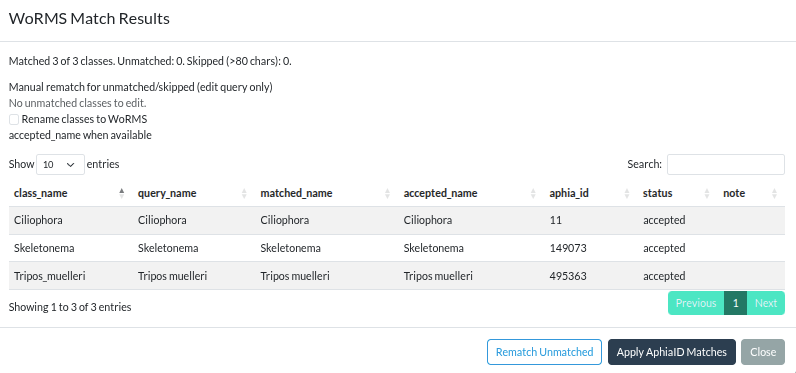
WoRMS match results modal with per-class manual rematch query inputs. Click to enlarge.
- Open Settings → Edit Class List
- Click Match WoRMS AphiaID
- Review accepted/synonym/unmatched/skipped results
- For unresolved classes, edit query fields and click Rematch Unmatched
- Click Apply AphiaID Matches
When applied, AphiaID values are saved in SQLite
(class_taxonomy table) and shown inline in the class list
display as [AphiaID: ...].
Note: AphiaID mappings are database metadata. They are not written into exported
class2use.mat/.txtfiles.
Auto-Sync
| Setting | Description |
|---|---|
| Auto-sync folders on startup | When enabled (default), the app checks and refreshes the file index on launch. Disable for instant startup using the existing cache. |
Python Configuration
The Python virtual environment path is configured when launching the app:
run_app(venv_path = "/path/to/your/venv")The path is remembered for future sessions. Priority
order: run_app(venv_path=) argument > saved
settings > default (./venv).
Live Prediction
| Setting | Description |
|---|---|
| Gradio API URL | URL of a Gradio-hosted CNN classification server
(e.g. https://irfcb-classify.hf.space) |
| Prediction Model | CNN model to use for classification. Choices are fetched from the Gradio server. |
When both fields are configured, a Predict button appears in the sidebar for Sample Mode. See Live Prediction for usage details.
Classifier Options
Apply classification threshold: When loading classifier output (CSV, H5, or MAT) or live predictions, use the threshold-filtered class predictions (checked) or the raw unthresholded predictions (unchecked).
PNG Export Options
Skip class from PNG export: Optionally exclude a class (e.g. “unclassified”) from the organized PNG output. Set in Settings under the PNG Output Folder section.
ZIP Export Notes
- ZIP export uses your current SQLite annotations as source.
- README content is generated from the package template and includes
archive provenance:
- ClassiPyR version used for export
- ClassiPyR citation text
- Per-class inventory files are named
ecotaxa_<CLASSNAME>.tsv.
MATLAB ZIP Export Notes
- MATLAB ZIP export bundles
.matannotations, feature CSVs,class2use.mat, and optionally raw data into a single archive suitable for sharing (e.g. for the SMHI IFCB Plankton Image Reference Library). - If your storage format is SQLite-only, annotations are converted to
.matfiles on the fly (requires Python with scipy). When using MAT or Both storage, existing.matfiles from the Output Folder are used directly. - The
class2use.matconfig file is generated automatically from the current class list. - For details on the archive structure and the underlying
iRfcb::ifcb_zip_matlab()function, see the iRfcb image export tutorial.
Statistics and Reporting
Session Cache
The app maintains two types of caches:
In-memory session cache (per session):
- Switching samples saves work automatically
- Returning to a sample restores your changes
- Cache persists until you close the app
Note: Always click Save before closing for permanent storage.
File index cache (persistent on disk):
- Stores the locations of all IFCB files across your configured folders
- Persists between sessions for fast startup
- See File Index Cache for details
Settings Persistence
ClassiPyR stores your settings in a configuration file
that follows R standards:
-
Linux:
~/.config/R/ClassiPyR/settings.json -
macOS:
~/Library/Preferences/org.R-project.R/R/ClassiPyR/settings.json -
Windows:
%APPDATA%/R/config/R/ClassiPyR/settings.json
Settings are loaded automatically when you start the app, so your
folder paths, class list location, and Python venv path are remembered
between sessions. Settings can be reset by specifying
run_app(reset_settings = TRUE).
Dependencies
ClassiPyR relies on:
-
iRfcbfor IFCB data operations (extracting images, reading ADC metadata, reading/writing.matfiles, class list handling) -
RSQLiteandDBIfor the SQLite annotation database
Optional dependencies:
-
hdf5rfor reading HDF5 (.h5) classifier output files. Install withinstall.packages("hdf5r").
All R dependencies are installed automatically when you install
ClassiPyR. Python is only needed for .mat file
export.